PAL Research Sampling Grids
At the beginning of the Palmer LTER program, two sampling grids were established to support the long-term observations of the West Antarctic Peninsula (WAP and near Palmer Station. These grids were initially outlined in Waters, K., & Smith, R. (1992). Palmer LTER: A sampling grid for the Palmer LTER program in Antarctic Journal of the United States (pp. 236–239).
PAL Regional Grid
The PAL LTER regional grid is defined as a 900km x 200km box running roughly parallel with the WAP. Fixed stations were creating using a UTM projection, rotated 50 degrees counterclockwise to align with the coastline. Sampling stations are defined along cardinal Grid Lines every 100km in a roughly NE direction, with Grid Stations defined every 20km from onshore to offshore.
Grid locations West of the Antarctic Peninsula may be calculated from latitude-longitude coordinates in order to establish a location within the LTER regional grid reference frame. For example, station 600.040 is the station closest to Palmer Station on Anvers Island, with the greatest sampling record.
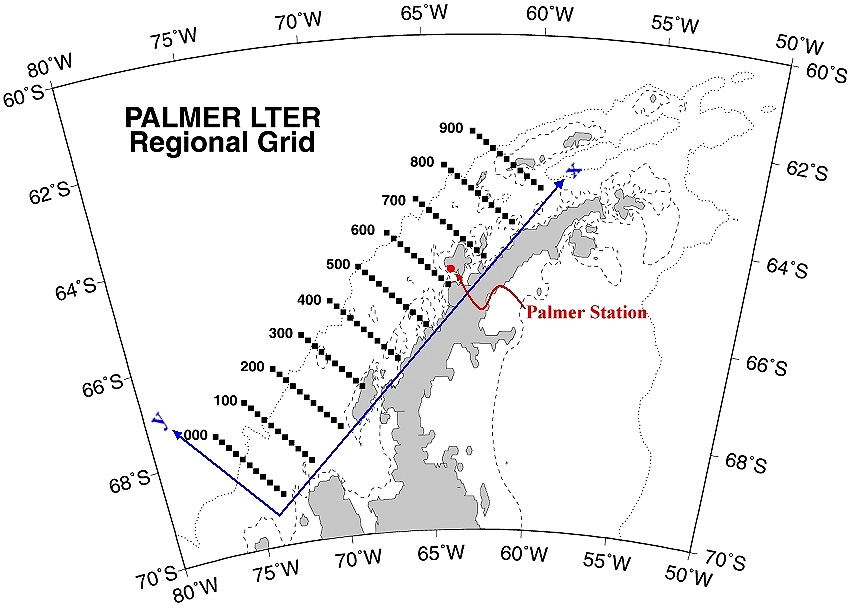
In recent years, the sampling grid has been extended south an additional 100 to 200 km. Occasional sampling beyond Grid Station 200, or inshore of Grid Station 0 has also occurred (e.g., station -100.-020 would translate to line -100 and station -20).
Palmer Basin Stations
At Palmer Station, a set of fixed stations are defined within 2 mile limit of station, allowing them to be regularly sampled by zodiacs or research vessels as part of the annual sampling strategy.
Grid Datasets
We provide pre-defined grid/station locations in the following datasets.
- WAP Survey Grid – Basic: Station locations for the 100km x 20km Palmer Station Antarctica LTER sampling grid
- WAP Survey Grid – Full: Station locations for the full Palmer Station Antarctica LTER sampling grid including the regular 100km x 20km grid, a higher-density 5km x 5km grid, inshore stations, Palmer Basin stations, a high-density grid, and various picket lines
Grid Converters
You can use our online grid converter to quickly convert a batch of Lat/Lon locations to Grid Line/Station, and vice versa.
If you are interested in Python or Matlab code, please reach out to the PAL Information Manager.
Cool Maps
The following papers include cool maps of the PAL grid.
- Brown, M. S., Munro, D. R., Feehan, C. J., Sweeney, C., Ducklow, H. W., & Schofield, O. M. (2019). Enhanced oceanic CO2 uptake along the rapidly changing West Antarctic Peninsula. Nature Climate Change, 9(9), 678–683. https://doi.org/10.1038/s41558-019-0552-3
- Conroy, J. A., Steinberg, D. K., Thibodeau, P. S., & Schofield, O. (2020). Zooplankton diel vertical migration during Antarctic summer. Deep Sea Research Part I: Oceanographic Research Papers, 162, 103324. https://doi.org/10.1016/j.dsr.2020.103324