New ADCP Backscatter Visualization Tool
Have you ever wondered what lies below the waters along the West Antarctic Peninsula?
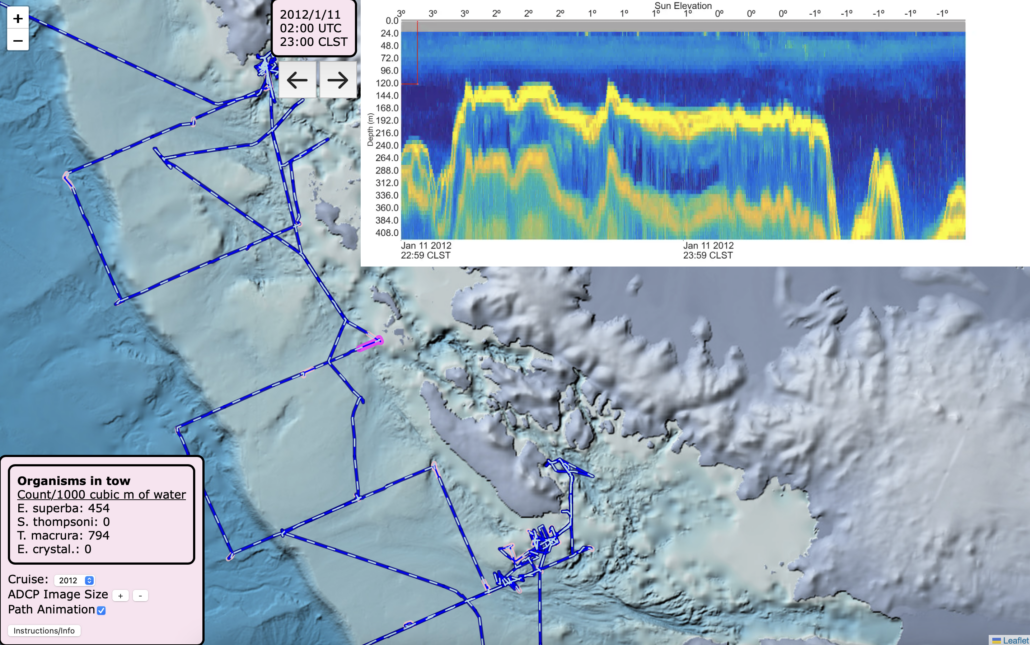
Now, you can use a new interactive map tool developed by former PAL graduate student Amanda Lohmann (now a PostDoc at the University of Virginia), to explore ADCP backscatter intensity data from the 2005-2016 cruises. The tool allows you to explore the vertical distribution of biomass in the water column, and even displays data from zooplankton tows when available.
Check it out and have fun exploring!